


Understanding market trend & how to analyze changes in market is crucial for stock investors. It helps them navigate the ever-changing developments in the market and make informed decisions. Let’s dive into the concept of trends in the stock market before we explore how to analyze them.
What is a Market Trend?
A market trend refers to the dominant direction in which a stock price, or even an entire market sector, is moving over a specific period. Imagine a stock price like a path on a hike. It can go uphill (prices rise) or downhill (prices fall). A trend emerges when this path seems to be consistently going in one direction for a while, rather than jumping around all the time.
Here's the key takeaway:
- Trends can be Upward (Bullish): This means prices are generally increasing over time.
- Trends can be Downward (Bearish): This means prices are generally decreasing over time.
The key for investors is to identify these trends because they can offer valuable insights:
- Understanding trends can help you make informed decisions about buying or selling stocks.
- Trends can reflect market sentiment: Are investors feeling optimistic (bullish) or pessimistic (bearish) about a particular company or sector?
- Longer trends are generally considered more reliable than short-term fluctuations. The longer a trend persists, the greater the confidence investors have in its direction. This increased confidence stems from the repeated confirmation of the price movement. As the trend continues, it becomes more likely to represent a fundamental shift in the market’s perception of a stock or sector.
Understanding Market Trend Analysis
Understanding market trend analysis is like Identifying the whispers of the market. It’s about identifying the prevailing direction – up, down, or sideways – that a stock price or even an entire market sector is likely moving in. Here’s a breakdown:
Why it Matters:
- Informed Decisions: By recognizing trends, you can make smarter choices about buying or selling stocks. Is a stock on a steady climb (uptrend), suggesting potential for growth? Or is it experiencing a consistent decline (downtrend), indicating a time to be cautious?
- Market Sentiment: Trends often reflect the collective mood of investors. Upward trends might signal optimism (bullish market), while downward trends could suggest pessimism (bearish market).
- Confidence Boost: The longer a trend lasts, the more confident investors become in its direction. This confidence comes from seeing the price movement confirmed over time.
The Catch:
- Not a Crystal Ball: Market trends aren’t foolproof predictions of the future. Prices can fluctuate due to short-term events.
- Time Frame Matters: Focus on a specific timeframe, like weeks, months, or even years, to identify a meaningful trend. Short-term blips don’t necessarily tell the whole story.
Key Takeaways:
- Sideways Trend: Prices are fluctuating within a specific range.
By understanding trend analysis, you gain valuable insights into the market’s inner workings, allowing you to navigate your investment decisions with greater confidence.
Once investors get an idea of trends, it’s time to learn some cool tricks! These tricks called “trend analysis strategies,” help them figure out what the trends mean and how to use them for buying and selling stocks.
What are the Different Types of Market Trend Analysis Strategies?

While some basic trend analysis methods might be familiar to investors, a deeper understanding of the various types and strategies can be highly beneficial:
- Moving Average
In technical analysis, the moving average (MA) serves as a technical indicator employed by traders to smooth out the short-term price volatility of a security. By calculating the average price over a defined timeframe, the moving average aims to capture the underlying trend and reduce the impact of random price fluctuations.
Imagine you have two lines on a stock chart: a fast line that tracks recent prices and a slow line that tracks prices over a longer period.
- When the fast line jumps above the slow line, some traders see this as a sign the stock might start going up (uptrend). So, they might buy the stock (enter long positions).
- On the other hand, if the fast line dips below the slow line, some traders might see this as a sign the stock might start going down (downtrend). So, they might sell the stock (enter short positions).
Let’s take the example of Tata Motors Ltd.
As we discussed with the above image, investors might choose to enter a long position when the short-term MA moves above the long-term MA
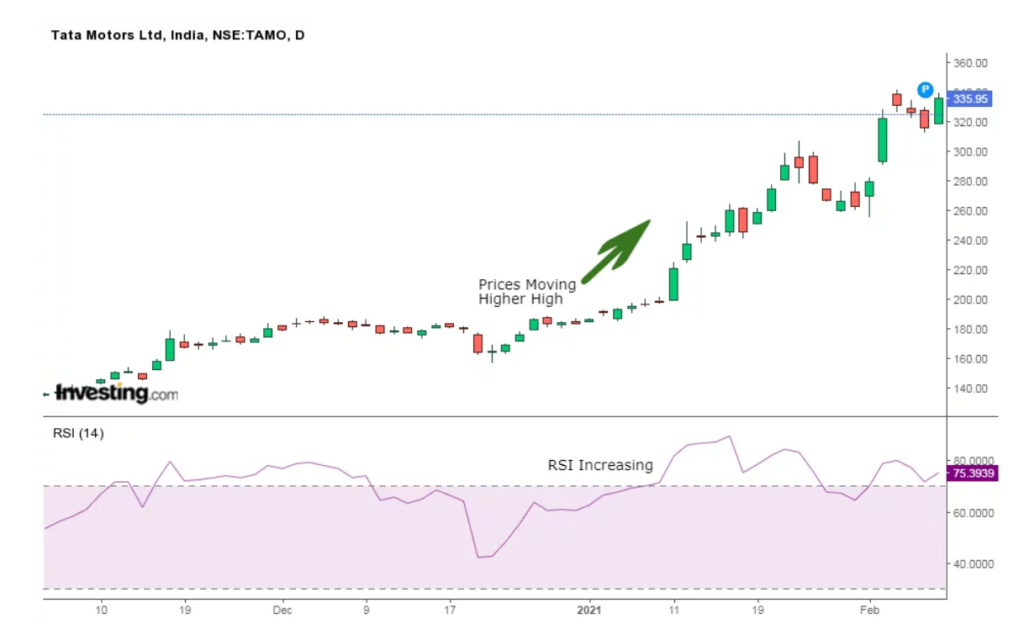
2. Momentum Indicators
Momentum indicators are a valuable tool in technical analysis that can help assess the strength or weakness of a stock’s price movement. These indicators focus on the speed of price changes, rather than just the direction. By analyzing momentum, investors can gain insights into potential turning points in a stock’s trend. Some popular examples of momentum indicators include the Moving Average Convergence Divergence (MACD) and the Relative Strength Index (RSI).
This momentum trading strategy focuses on capturing strong price movements. Investors enter long positions (buy the stock) when the price is experiencing significant upward momentum, aiming to benefit from a potential continuation of the uptrend. However, they exit their positions (sell the stock) when the upward momentum starts to fade, potentially indicating a trend reversal. The Relative Strength Index (RSI) is a popular tool used by investors to identify these momentum shifts. The RSI helps them gauge whether a stock is becoming overbought (losing upward momentum) or oversold (losing downward momentum).
As discussed with momentum trading, the case of Tata Motors Ltd. illustrates how the share price can trend higher when there’s increased momentum
3. Trendlines & Chart Patterns
In technical analysis, trendlines are graphical representations formed by connecting a series of price points on a stock chart. These lines help identify potential support and resistance levels, which are areas where the price may find temporary buying or selling pressure, respectively.
Investors utilizing the trendline breakout strategy aim to capitalize on strong uptrends. They enter long positions (buy the stock) when the price decisively breaks above a key resistance level identified by a trendline. This breakout suggests a potential continuation of the uptrend. To manage risk, investors typically place a stop-loss order below the broken support level, which acts as a buffer in case the price movement reverses.
Let’s take the example of Tata Motors Ltd. once again.
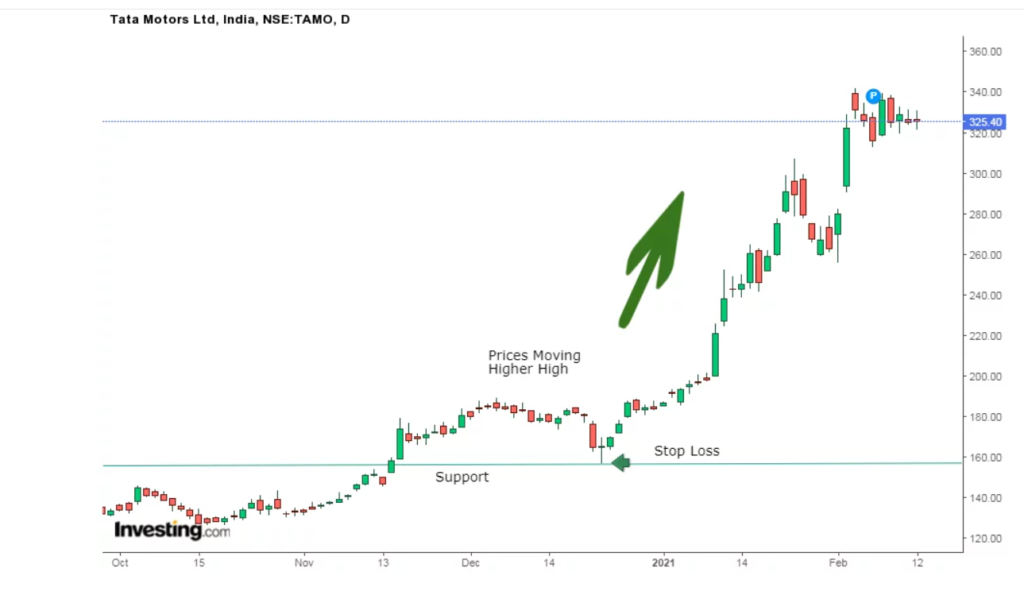
As we discussed with trendline breakouts, traders can place a stop-loss order at or below the support level when a stock exhibits an uptrend. This helps manage risk in case the price breaks the trendline and reverses course.
Market trend analysis strategies offer valuable tools for traders by:
- Simplifying complex price data: These strategies help translate raw price movements into actionable insights.
- Identifying potential turning points: By analyzing trends, traders can spot potential reversal signals, indicating a possible shift in the direction of a stock’s price movement.
- Generating trade signals: Trend analysis strategies can provide buy and sell signals based on identified trends and technical indicators.
The beauty of these strategies lies in their flexibility. Investors can combine various approaches and customize them to align with their individual risk tolerance and investment goals.
Your Take
Financial professionals advise that traders shouldn’t rely on a single trend analysis method. Instead, combining different methods can lead to a more robust trading strategy. (This emphasizes the strength of combining methods.)
Happy Investing!
Disclaimer: This blog is solely for educational purposes. The securities/investments quoted here are not recommendatory.